遇到的问题
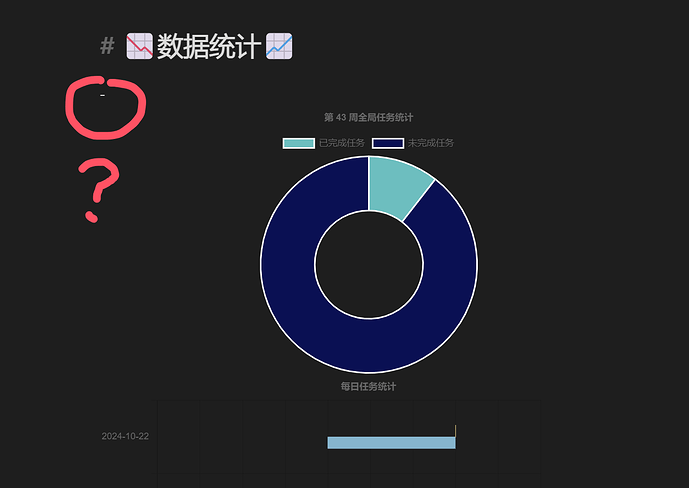
我正在编写我的周记的模板,想要生成一些数据统计图表,我已经实现了我想要的数据统计的功能,但是在渲染图表的时候会在左上方出现一个减号(“-”),这是为什么呢,有什么办法解决吗
我obsidian的版本是1.7.4,dataview版本是0.5.67
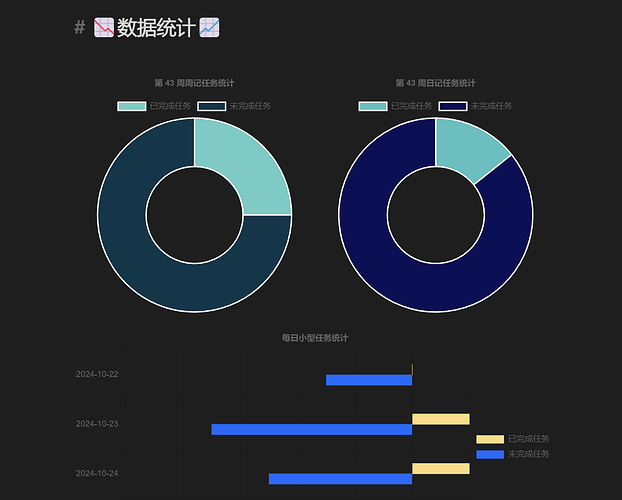
预期的效果
预期是只有图表,没有左上角的减号
已尝试的解决方案
完全没有思路
以下是我的代码:
const ctx = dv.el("div");

// 导入 Chart.js
await import("https://cdnjs.cloudflare.com/ajax/libs/Chart.js/4.2.1/chart.umd.js");

// 获取周记的周数和年份
const weekNumber = parseInt(dv.current().file.name.split("第")[1]);
const year = dv.current().file.name.split("-")[0];

const startOfWeek = moment(`${year}-W${weekNumber}`).startOf('isoWeek');
const endOfWeek = moment(`${year}-W${weekNumber}`).endOf('isoWeek');

// 获取对应周的日记
const diaryPages = dv.pages('"Days"')
    .where(p => moment(p.file.name, "YYYY-MM-DD").isBetween(startOfWeek, endOfWeek, null, '[]'));

// 准备日记统计数据
const labels = [];
const diaryCompletedCounts = [];
const diaryTotalCounts = [];

diaryPages.forEach(page => {
    const tasks = page.file.tasks || [];
    const completed = tasks.filter(t => t.completed).length;
    const total = tasks.filter(t => t.text.trim() !== "").length; // 统计非空任务

    labels.push(page.file.name);
    diaryCompletedCounts.push(completed);
    diaryTotalCounts.push(total);
});

// 计算总任务和已完成任务
const totalCompleted = diaryCompletedCounts.reduce((sum, count) => sum + count, 0);
const totalTasks = diaryTotalCounts.reduce((sum, count) => sum + count, 0);
const totalPending = totalTasks - totalCompleted; // 计算未完成任务

// 创建环形图
const doughnutContainer = document.createElement("div");
doughnutContainer.style.width = "50%"; // 设置容器宽度
doughnutContainer.style.margin = "0 auto"; // 中心对齐
doughnutContainer.style.position = "relative"; // 相对定位
ctx.appendChild(doughnutContainer); // 将容器添加到 ctx

const doughnutCanvas = doughnutContainer.appendChild(document.createElement("canvas"));

const doughnutConfig = {
    type: 'doughnut',
    data: {
        labels: ['已完成任务', '未完成任务'],
        datasets: [{
            data: [totalCompleted, totalPending],
            backgroundColor: ['rgba(75, 192, 192, 1)', 'rgb(9, 16, 87)'],
        }]
    },
    options: {
        responsive: true,
        plugins: {
            legend: {
                position: 'top',
            },
            title: {
                display: true,
                text: `第 ${weekNumber} 周全局任务统计` // 添加标题
            },
            tooltip: {
                callbacks: {
                    label: (tooltipItem) => {
                        const idx = tooltipItem.dataIndex;
                        return `${tooltipItem.label}: ${tooltipItem.raw}`;
                    }
                }
            }
        }
    }
};
new Chart(doughnutCanvas.getContext("2d"), doughnutConfig);

// Horizontal Bar Chart

const horizontalBarCanvas = ctx.appendChild(document.createElement("canvas"));

const horizontalBarConfig = {
    type: 'bar',
    data: {
        labels: labels,
        datasets: [
            {
                label: '已完成任务',
                data: diaryCompletedCounts,
                backgroundColor: '#FFDC7F',
                barThickness: 15,
                categoryPercentage: 0.5,
                barPercentage: 0.5,
                // 将已完成的任务设置为正值
            },
            {
                label: '未完成任务',
                data: diaryTotalCounts.map((total, index) => total - diaryCompletedCounts[index]),
                backgroundColor: '#78B7D0',
                barThickness: 15,
                categoryPercentage: 0.5,
                barPercentage: 0.5,
                // 将未完成的任务设置为负值
                data: diaryTotalCounts.map((total, index) => -(total - diaryCompletedCounts[index])),
            }
        ]
    },
    options: {
        indexAxis: 'y', // 水平条形图
        responsive: true,
        plugins: {
            legend: {
                position: 'right',
            },
            title: {
                display: true,
                text: '每日任务统计'
            }
        },
        scales: {
            x: {
                stacked: false,
                ticks: {
                    callback: function(value) {
                        return Math.abs(value); // 只显示正值
                    }
                }
            },
            y: {
                stacked: false,
           }
        }
    }
};

new Chart(horizontalBarCanvas, horizontalBarConfig);


// 计算累计完成任务数
const cumulativeCompletedCounts = [];
let cumulativeSum = 0;

diaryCompletedCounts.forEach(count => {
    cumulativeSum += count;
    cumulativeCompletedCounts.push(cumulativeSum);
});

// 折线图
const lineCanvas = ctx.appendChild(document.createElement("canvas"));
const lineConfig = {
    type: 'line',
    data: {
        labels: labels,
        datasets: [
            {
                label: '每日完成的任务数',
                data: diaryCompletedCounts,
                borderColor: '#36A2EB',
                fill: false,
                tension: 0.4, // 设置平滑程度,0 为直线,1 为完全平滑
                borderWidth: 2,
                borderCapStyle: 'round', // 设置线段端点的样式
            },
            {
                label: '累计完成任务数',
                data: cumulativeCompletedCounts,
                borderColor: '#FF5733', // 设置累计曲线的颜色
                fill: false,
                tension: 0.4,
                borderWidth: 2,
                borderCapStyle: 'round',
            }
        ]
    },
    options: {
        responsive: true,
        plugins: {
            title: {
                display: true,
                text: '本周每天完成的任务数与累计完成任务数'
            },
        },
        interaction: {
            intersect: false,
        },
        scales: {
            x: {
                display: true,
                title: {
                    display: true,
                    text: '日期'
                }
            },
            y: {
                display: true,
                title: {
                    display: true,
                    text: '任务数'
                },
                suggestedMin: 0,
            }
        }
    }
};

new Chart(lineCanvas.getContext("2d"), lineConfig);

