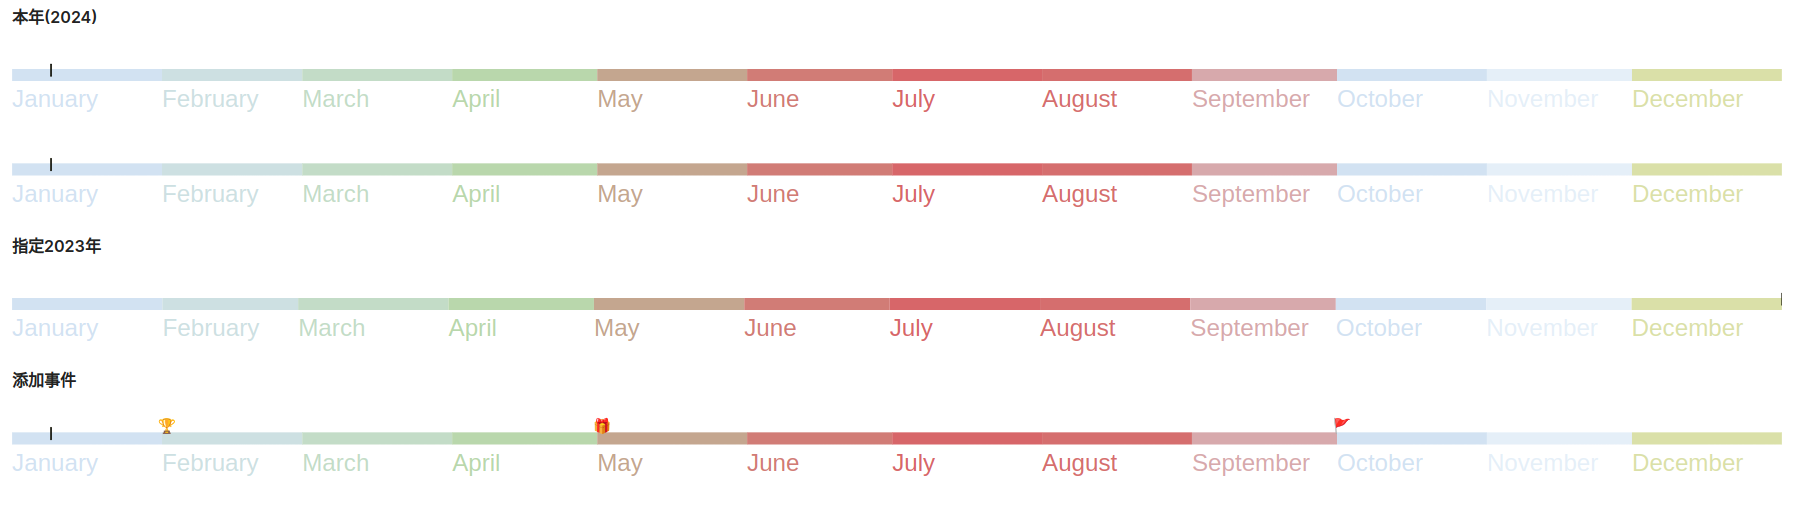
是要创建这样的timeline:
最开始的讨论是在SVG Year timeline in your daily note (now a plugin),我自己使用的要求是:
- 在timeline上用*icon(emoji)*标注当前日期;
- 支持添加事件,自动根据日期计算位置并标注一个icon在timeline上;
- icon支持类似html图片的
alt text,指针掠过时显示; - 支持多timeline独立定制;
后来就像SVG Year timeline in your daily note (now a plugin)的标题写的,now a plugin,plugin是Obsidian year timeline plugin, 简单看了下,可能有理解错误,但我发现它有几条不能满足的要求:
- 事件不能添加
alt text; - 支持输入
<svg> ... </svg>完全地自己定制,但这样事件的位置就要根据日期自己计算; - 看上去配置好的timeline是共享的,在不同的位置引用的是同一个timeline;
所以我自己改进一下,下面是介绍:
- 依赖dataviewjs;
- 文件是year-timeline.js,放置在vault_root/Scripts;
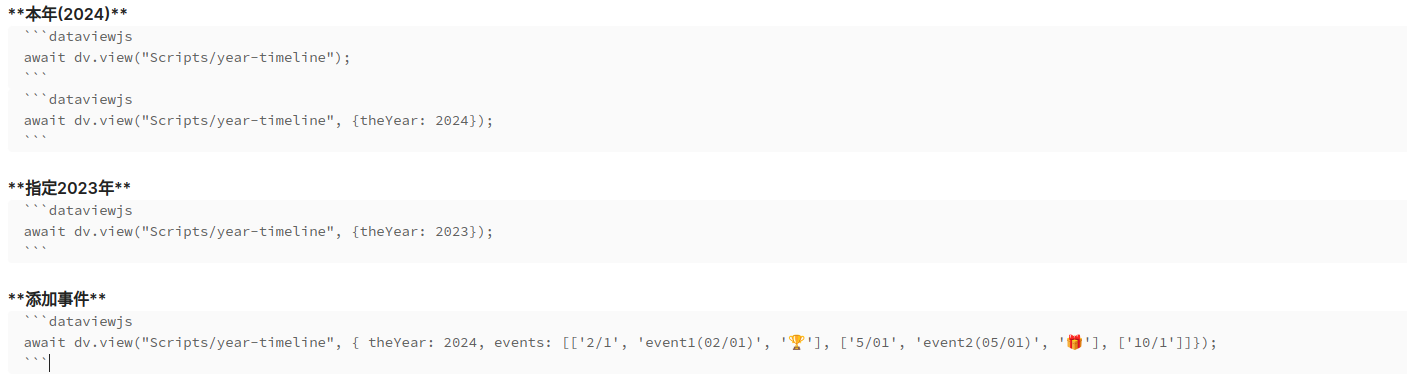
- 几个示例
最后,
- 我不是写js的,用的js语法也是边搜索边用,所以很不专业,比如处理最终的
<svg> ... </svg>内容,js肯定有专门的模块来处理; - 没仔细处理,比如有边界icon显示会超出边界;
- 以后有时间好好了解下js,增强Obsidian year timeline后用它来处理是最好的选择;
year-timeline.js
function daysInMonth(month, year) {
    return new Date(parseInt(year), parseInt(month) + 1, 0).getDate();
}

function isLeapYear(p_intYear) {
    return (p_intYear % 100 === 0) ? (p_intYear % 400 === 0) : (p_intYear % 4 === 0);
}

function dayOfTheYear(date) {
    return Math.floor((date - new Date(date.getFullYear(), 0, 0)) / 1000 / 60 / 60 / 24);
}

const basePath = app.vault.adapter.basePath;//absolute path to your vault
const jsLibPath = basePath + '/Scripts/';

if (input !== undefined) {
    var year = input['theYear'];
    var events = input['events'];
}

function createYearData(year, eventList) {
    const monthNames = ["Jan", "Feb", "Mar", "Apr", "May", "Jun", "Jul", "Aug", "Sep", "Oct", "Nov", "Dec"];

    var currentDate = new Date();
    var theYear = currentDate.getFullYear();
    if (year === undefined || year == theYear) {
        var dayOfYear = dayOfTheYear(currentDate);
    } else {
        var theYear = year;
        var currentDate = new Date(theYear, 11, 31);
        if (isLeapYear()) {
            var dayOfYear = 366;
        } else {
            var dayOfYear = 365;
        }
    }
    let currentPos = dayOfYear * 10;
    let currentPosLabel = monthNames[currentDate.getMonth()] + " " + currentDate.getDate();

    var barX = [];
    var barWidth = [];
    for (const x of Array(12).keys()) {
        barWidth.push(daysInMonth(x, theYear) * 10);
        if (barX.length == 0) {
            barX.push(0);
        } else {
            barX.push(barX[barX.length-1] + barWidth[barX.length-1]);
        }
    }
    if (isLeapYear(theYear)) {
        var daysOfYearW = 3660;
    } else {
        var daysOfYearW = 3650;
    }

    const timeHtmlPartI = `<svg viewBox="0 -50 ${daysOfYearW} 150">
<title>Timeline ${theYear}</title>
<g class='bars'>
    <rect fill='#D1E2F3' x='${barX[0]}' width='${barWidth[0]}' height='25'></rect>
    <rect fill='#CCE0E2' x='${barX[1]}' width='${barWidth[1]}' height='25'></rect>
    <rect fill='#C2DCC5' x='${barX[2]}' width='${barWidth[2]}' height='25'></rect>
    <rect fill='#B8D7A8' x='${barX[3]}' width='${barWidth[3]}' height='25'></rect>
    <rect fill='#C5A68D' x='${barX[4]}' width='${barWidth[4]}' height='25'></rect>
    <rect fill='#D37B74' x='${barX[5]}' width='${barWidth[5]}' height='25'></rect>
    <rect fill='#DA6467' x='${barX[6]}' width='${barWidth[6]}' height='25'></rect>
    <rect fill='#D76C6C' x='${barX[7]}' width='${barWidth[7]}' height='25'></rect>
    <rect fill='#D8A8AC' x='${barX[8]}' width='${barWidth[8]}' height='25'></rect>
    <rect fill='#D1E2F3' x='${barX[9]}' width='${barWidth[9]}' height='25'></rect>
    <rect fill='#E5EFF9' x='${barX[10]}' width='${barWidth[10]}' height='25'></rect>
    <rect fill='#DAE0A3' x='${barX[11]}' width='${barWidth[11]}' height='25'></rect>
</g>
<g class='labels' style="font-size:50px; font-family:arial" text-anchor="middle">
    <text fill='#D1E2F3' x='${barX[0]}' y='80' text-anchor="start">January</text>
    <text fill='#CCE0E2' x='${barX[1]}' y='80' text-anchor="start">February</text>
    <text fill='#C2DCC5' x='${barX[2]}' y='80' text-anchor="start">March</text>
    <text fill='#B8D7A8' x='${barX[3]}' y='80' text-anchor="start">April</text>
    <text fill='#C5A68D' x='${barX[4]}' y='80' text-anchor="start">May</text>
    <text fill='#D37B74' x='${barX[5]}' y='80' text-anchor="start">June</text>
    <text fill='#DA6467' x='${barX[6]}' y='80' text-anchor="start">July</text>
    <text fill='#D76C6C' x='${barX[7]}' y='80' text-anchor="start">August</text>
    <text fill='#D8A8AC' x='${barX[8]}' y='80' text-anchor="start">September</text>
    <text fill='#D1E2F3' x='${barX[9]}' y='80' text-anchor="start">October</text>
    <text fill='#E5EFF9' x='${barX[10]}' y='80' text-anchor="start">November</text>
    <text fill='#DAE0A3' x='${barX[11]}' y='80' text-anchor="start">December</text>
</g>
<g>
<!-- <text fill="white" x="${currentPos}" y="-2" style="font-size:50px;">
        <title>${currentPosLabel}</title>🦸
    </text> -->
    <rect style="fill:yellow;stroke-width:2px;stroke:black" x='${currentPos}' y='-10' width='1' height='25'>
        <title>${currentPosLabel}</title>
    </rect>
</g>
`
    if (eventList !== undefined) {
        var timeHtmlEvents = `<g class="events" style="font-size:30px;" text-anchor="middle">`
        for (var en in eventList) {
            let ed = new Date(theYear + '/' + eventList[en][0]);
            let ePos = dayOfTheYear(ed) * 10;
            let eTitle = "Event";
            let eIcon = "🚩";
            let eLength = eventList[en].length;
            if (eventList[en][1] !== undefined) {
                eTitle = eventList[en][1];
            }
            if (eventList[en][2] !== undefined) {
                eIcon = eventList[en][2];
            }
            timeHtmlEvents += `
    <text fill="white" x="${ePos}" y="-3">
        <title>${eTitle}</title>${eIcon}
    </text>`
        }
        timeHtmlEvents += `
</g>`
    }


const timeHtmlPartII = `
</svg>`;

    return timeHtmlPartI + timeHtmlEvents + timeHtmlPartII;
}

dv.paragraph(createYearData(year, events));