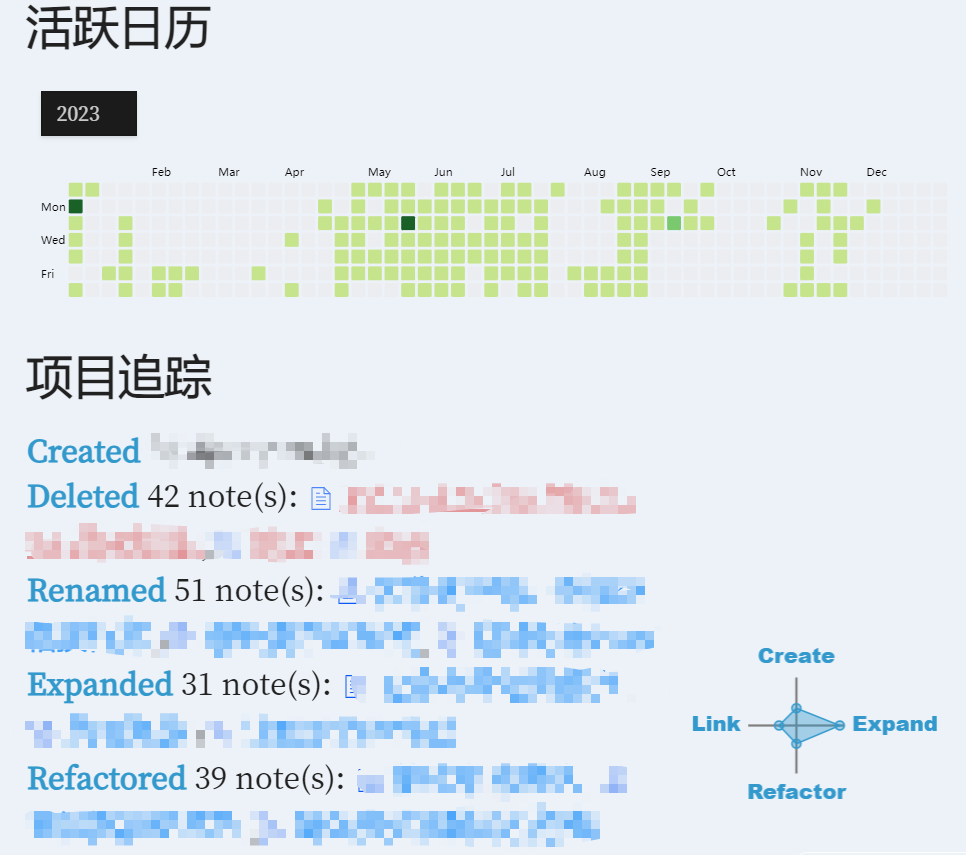
#最后效果
发现过程
在完善obsidian主页的时候很想要一个github热力图样式的、以时间角度看最近工作进度的表格,用来鞭策自己少摸鱼 ![]()
然后翻阅到插件heatmap-calendar-obsidian很符合需求
ps:heatmap-calendar需要dataview插件
官网默认配置代码片 注释我翻译了一下
dv.span("** 😊 Title  😥**") /* 标题头 optional ⏹️💤⚡⚠🧩↑↓⏳📔💾📁📝🔄📝🔀⌨️🕸️📅🔍✨ */
const calendarData = {
    year: 2022,  // (optional) defaults to current year 想要那年的日历不配置就是当前年
    colors: {    // (optional) defaults to green 色卡样式 个人推荐把这些拷贝到heatmap-calendar插件设置里面,不要在这里配置
        blue:        ["#8cb9ff", "#69a3ff", "#428bff", "#1872ff", "#0058e2"], // first entry is considered default if supplied
        green:       ["#c6e48b", "#7bc96f", "#49af5d", "#2e8840", "#196127"],
        red:         ["#ff9e82", "#ff7b55", "#ff4d1a", "#e73400", "#bd2a00"],
        orange:      ["#ffa244", "#fd7f00", "#dd6f00", "#bf6000", "#9b4e00"],
        pink:        ["#ff96cb", "#ff70b8", "#ff3a9d", "#ee0077", "#c30062"],
        orangeToRed: ["#ffdf04", "#ffbe04", "#ff9a03", "#ff6d02", "#ff2c01"]
    },
    showCurrentDayBorder: true, // (optional) defaults to true  当前天是否加一个黑色框框
    defaultEntryIntensity: 4,   // (optional) defaults to 4
    intensityScaleStart: 10,    // (optional) defaults to lowest value passed to entries.intensity
    intensityScaleEnd: 100,     // (optional) defaults to highest value passed to entries.intensity
    entries: [],                // (required) populated in the DataviewJS loop below
}

//DataviewJS loop
for (let page of dv.pages('"daily notes"').where(p => p.exercise)) {
    //dv.span("<br>" + page.file.name) // uncomment for troubleshooting
    calendarData.entries.push({
        date: page.file.name,     // (required) Format YYYY-MM-DD 热力图填色时间,必填,格式必须是YYYY-MM-DD
        intensity: page.exercise, // (required) the data you want to track, will map color intensities automatically  你在文章中自定义用来过滤文章的关键词必填
        content: "🏋️",           // (optional) Add text to the date cell  填色块上填emoji 选填
        color: "orange",          // (optional) Reference from *calendarData.colors*. If no color is supplied; colors[0] is used  填色块 色卡样式选择
    })
}

renderHeatmapCalendar(this.container, calendarData)  //热力图渲染
使用过程
- 首先在文章配置过滤关键词,关键词是自定义的,测试中英文都行,配置在文章头如下
关键词:数值
如果是类似课程数值理解为频次、如果是当作记账就写金额(直接数字不要金钱符号¥)、如果是锻炼可写时间(时间本人没有用,数据格式要求不知道,看github上写的是 21 minutes)。数值越大填色块颜色越深。
---
learn: 1
---

标题1
标题2
。。。
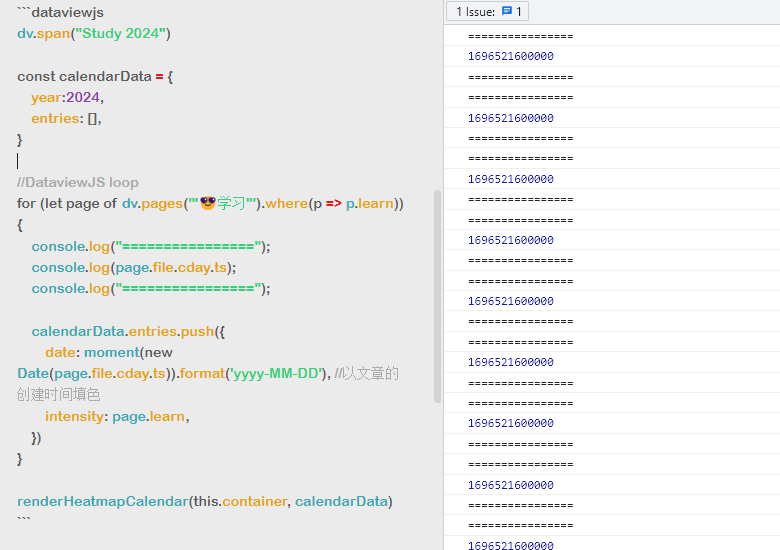
- 在想看到热力图的地方贴代码片,本人贴在主页
dv.span("Study💨")

const calendarData = {
    entries: [],
}

//DataviewJS loop
for (let page of dv.pages('"🥯学习"').where(p => p.learn)) {
    calendarData.entries.push({
        date: moment(new Date(page.file.cday.ts)).format('yyyy-MM-DD'), //以文章的创建时间填色
        intensity: page.learn,
    })
}

renderHeatmapCalendar(this.container, calendarData)
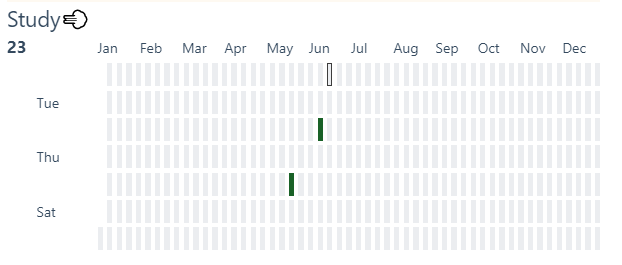
#遇到的坑+思考过程
作者给的代码片段上的date是文章名称,我的需求是文章创建时间,然后for循环的那个date配置要求是yyyy-MM-DD的格式的
然后本人靠着ctrl cv经验,知道page.file.cday可以满足我的需求,虽然在Dataview设置里面把日期调成yyyy-MMMM-dd,但直接用不生效。
本人觉得是日期格式问题百度日期转换遇到了坑
网上的代码
const date = new Date();
console.log(moment(date).format('YYYY-MM-DD HH:mm:ss')); // 2023-02-18 21:49:05
console.log(dateFns.format(date, 'yyyy-MM-dd HH:mm:ss')); // 2023-02-18 21:49:05
本人第一版理解
for (let page of dv.pages('"🥯学习"').where(p => p.learn)) {
    calendarData.entries.push({
        date: moment(page.file.cday).format('YYYY-MM-DD HH:mm:ss'),
        intensity: page.learn,
    })
}
但永远都只是当前天有颜色 ,moment(page.file.cday)这个输出的是当日时间,new Date(page.file.cday.ts)就是实际创建时间